
16 October 2024
Understanding your company’s past performance is crucial for informed decision-making. Variance analysis, a fundamentally practical exercise, compares actual results to forecasts you have done in the past so as to provide a counterpoint to scenario planning and budgeting.
Performed regularly, variance analysis disciplines the forecasting endeavor, enforcing timely “reality checks” to enable strategic steering. For managers, it also provides a yardstick to measure operational adherence to plans and make sure the company’s strategy is actually being implemented.
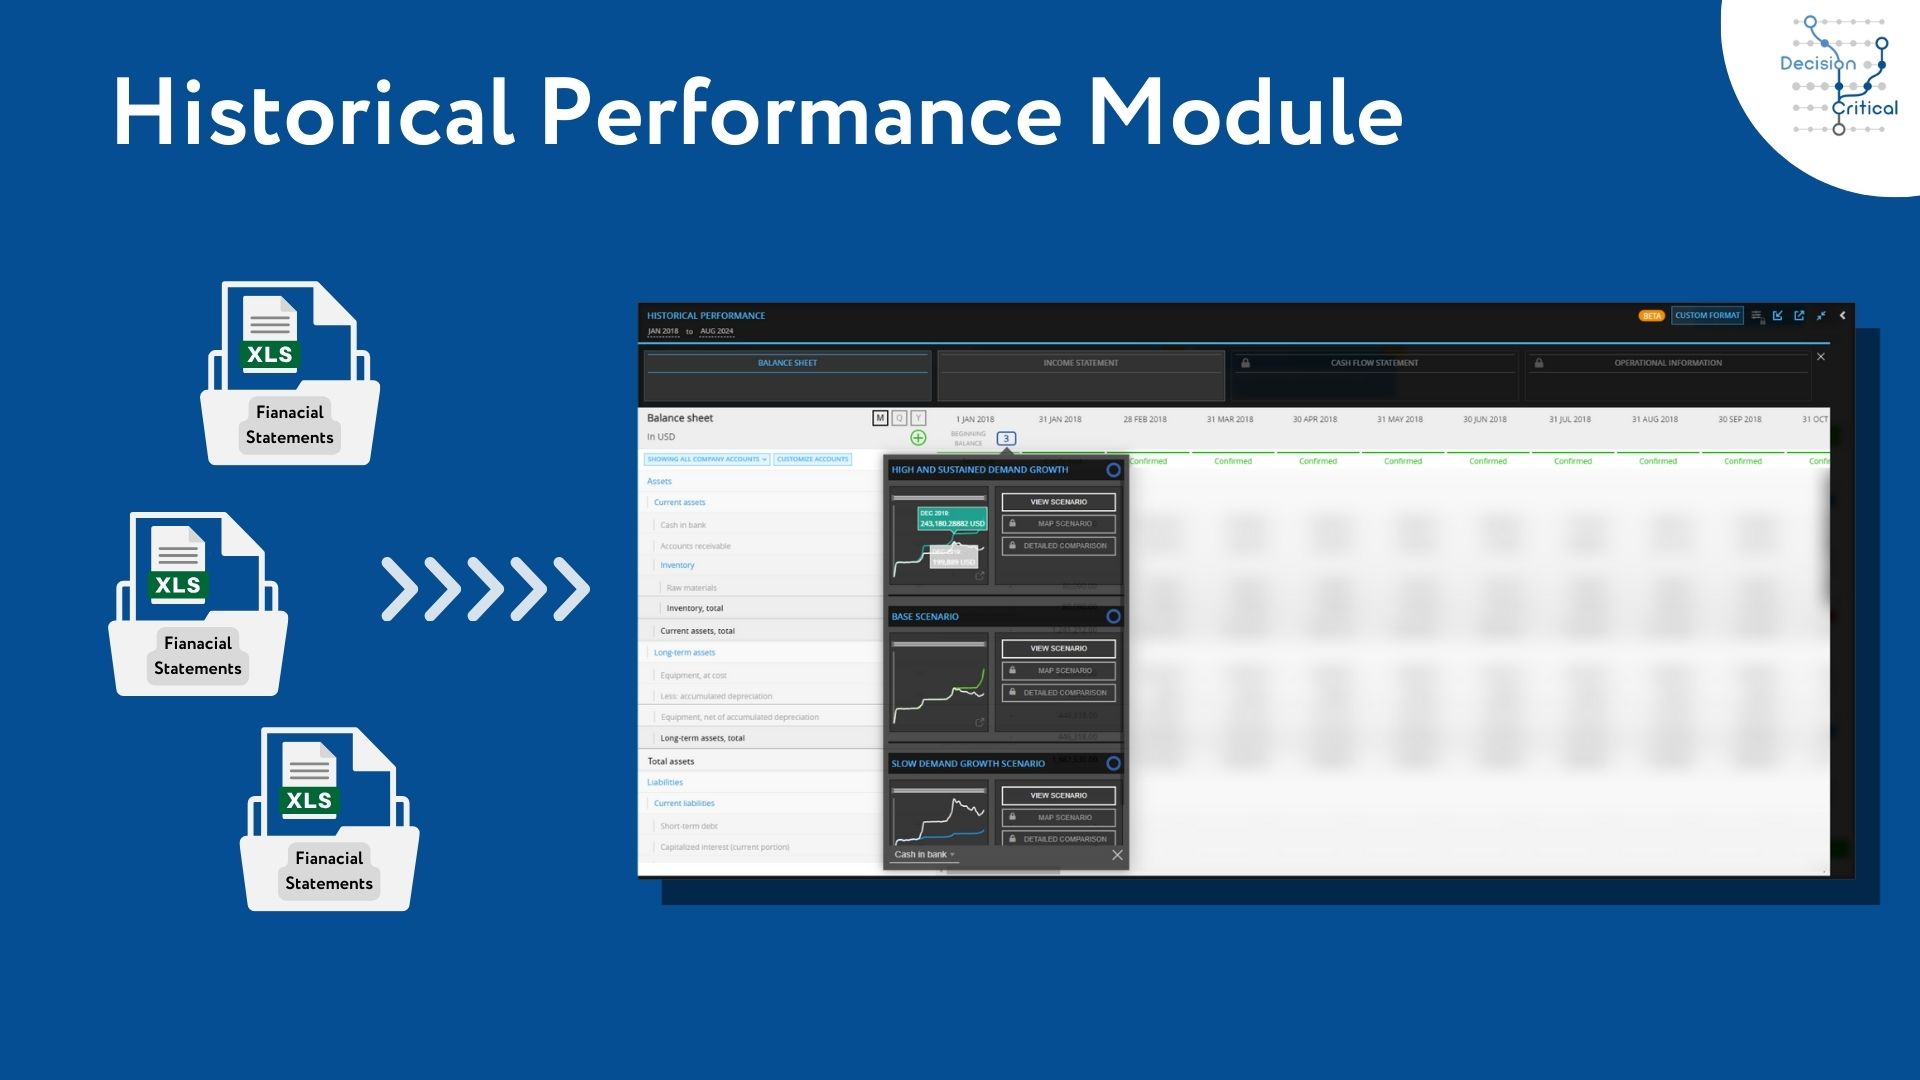
That’s why Decision Critical is happy to announce our new Historical Performance module – a powerful variance analysis tool which complements our main scenario modeler, providing an easy, informative link between projected outcomes and actual results.
Integrate actual results deeply into your planning processes: drill down into differences, identify root causes, analyze trends and identify / react to unexpected developments while they are still manageable. With the addition of our Historic Performance module, you can now use Decision Critical to both decipher past performance and confidently plan for the future.
What is Historical Performance in Decision Critical?
While maintaining a forward focus is essential to using your business plan to drive performance, understanding past results is also crucial to preserve realism. Grounding your strategic plan in practical data helps avoid the twin perils of unfounded optimism and excessive caution.
The Decision Critical Historical Performance module maps your company’s balance sheet and income statement to your Decision Critical financial models for a powerful corporate performance management (CPM) solution. We’ve made it easier than ever to integrate your Historical Reports and track them against multiple forecasts. With an intuitive interface and customizable views, you can drill down into variances and drivers in specific periods and analyze the metrics that matter most to your business.
Implementing the Historical Performance module divided into 4 simple steps: (1) import data; (2) map accounts; (3) confirm / validate; (4) analyze. See individual sections below for an introduction to each:
Where Can I Find Historical Performance?
- Historical Performance can be found in your company (/analytics page) next to the Knowledge Bank button.

Sleek Data Import and “Spreadsheet Mode” for Painless Updates
Established operations modeling in Decision Critical may want to start by importing historic financial statements.
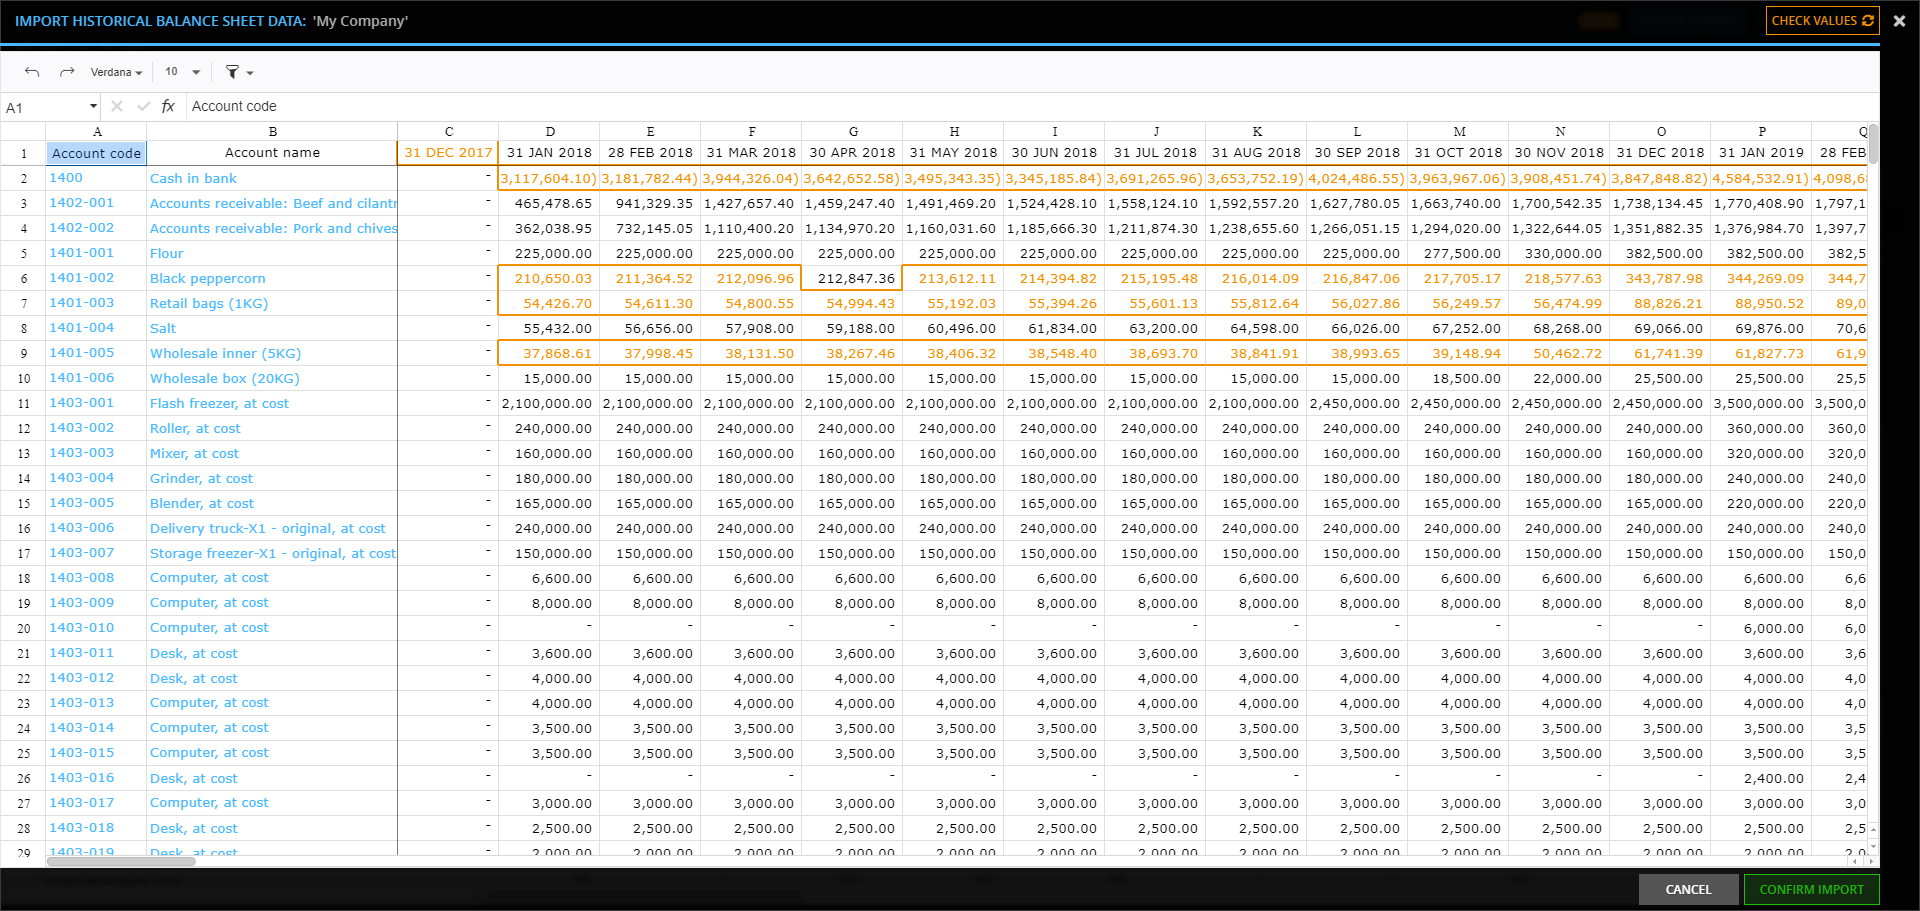
For many CPMs, import of historical financial reports involves extensive data-prepping that can be time-consuming and error-prone. Decision Critical's Historical Performance module includes a turnkey integrative layer for a painless, intuitive import process.
The balance sheet or income statement is simply dragged into the import window and instantly shown as an import preview in Decision Critical’s new “spreadsheet mode”. Any questionable value will be flagged automatically by the heat map function. Before the import is confirmed, changes can be made inside the preview window itself, including direct copy-paste of financial data.
Tip: For detailed instructions on importing your balance sheets and income statements, see our help article.
Seamless Account Mapping to Connect Data
After confirming your import, you’ll be transported to the “Chart of accounts mapping" screen. You can also access mapping functionality at any time via the “Custom format” button in the module’s main interface.
“Chart of accounts mapping” is the interface where you anchor specific, custom accounts from your company’s chart of accounts to the standard accounts used in your Decision Critical models.
This is a simple matching exercise that you only need to do once for any given account. To match an account, just: (1) identify the account name; (2) select the account you want to map to; (3) check the result, and it’s done! The data on your account is successfully mapped within the system, ready to use in variance analysis.
Tip: For a deep dive on account mapping, see the relevant help article.
Improve accuracy with Advanced Data Validation
The main interface in the Historical Performance module is set up to facilitate review of imported data. It also supports direct input.
To ease variance analysis, this interface uses the standard chart of accounts from your Decision Critical models. If you are dealing with inputs that have been imported and mapped, you can click on “Input details” to view the drill down report.
In addition to support of the main variance analysis task, the main Historical Reports interface incorporates advanced data validation, flagging reports for internal consistency and tracking which values have been validated by someone from your organization and which are still in process.
Tip: For more detail on advanced data validation, see the relevant help article (e.g., what each status means, how to get a 'Confirmed' status, etc.).

Variance Analysis: Decoding Performance and Correcting Course
Certainly, the ultimate goal of the Historical Performance module is the leveraging of variance analysis to provide powerful, objective insights in the context of your strategic plan.
Decision Critical does this visually and effectively through multiple comparative graphing options. Access month-to-month comparative graphs both inside the Historical Performance module and in the main Analytics dashboard for your company. Zoom in on specific periods, hover over data points to view exact values, and add different models from your scenario analysis to identify trends, flag deviations and analyze variances.
Integration of variance analysis into your financial processes is a valuable ritual that boosts organizational agility in several ways:
Early warning system: Monitor implementation of strategy to make sure planned activities actually take place and that performance bottlenecks are noted. Identify where actual performance diverges from expectations and drill down on the causes.
Understand trends: Where divergences are attributed to external events, note them early and make sure your scenario analysis includes the scenario you actually find yourself in.
Adjust tactics in a timely fashion: Variance analysis, once digested, should loop back into scenario analysis for maximum impact, allowing you to quickly adjust your approach to address issues or capitalize on positive trends.
Tip: For a step-by-step tour of the variance analysis screens in Decision Critical, see our help article.
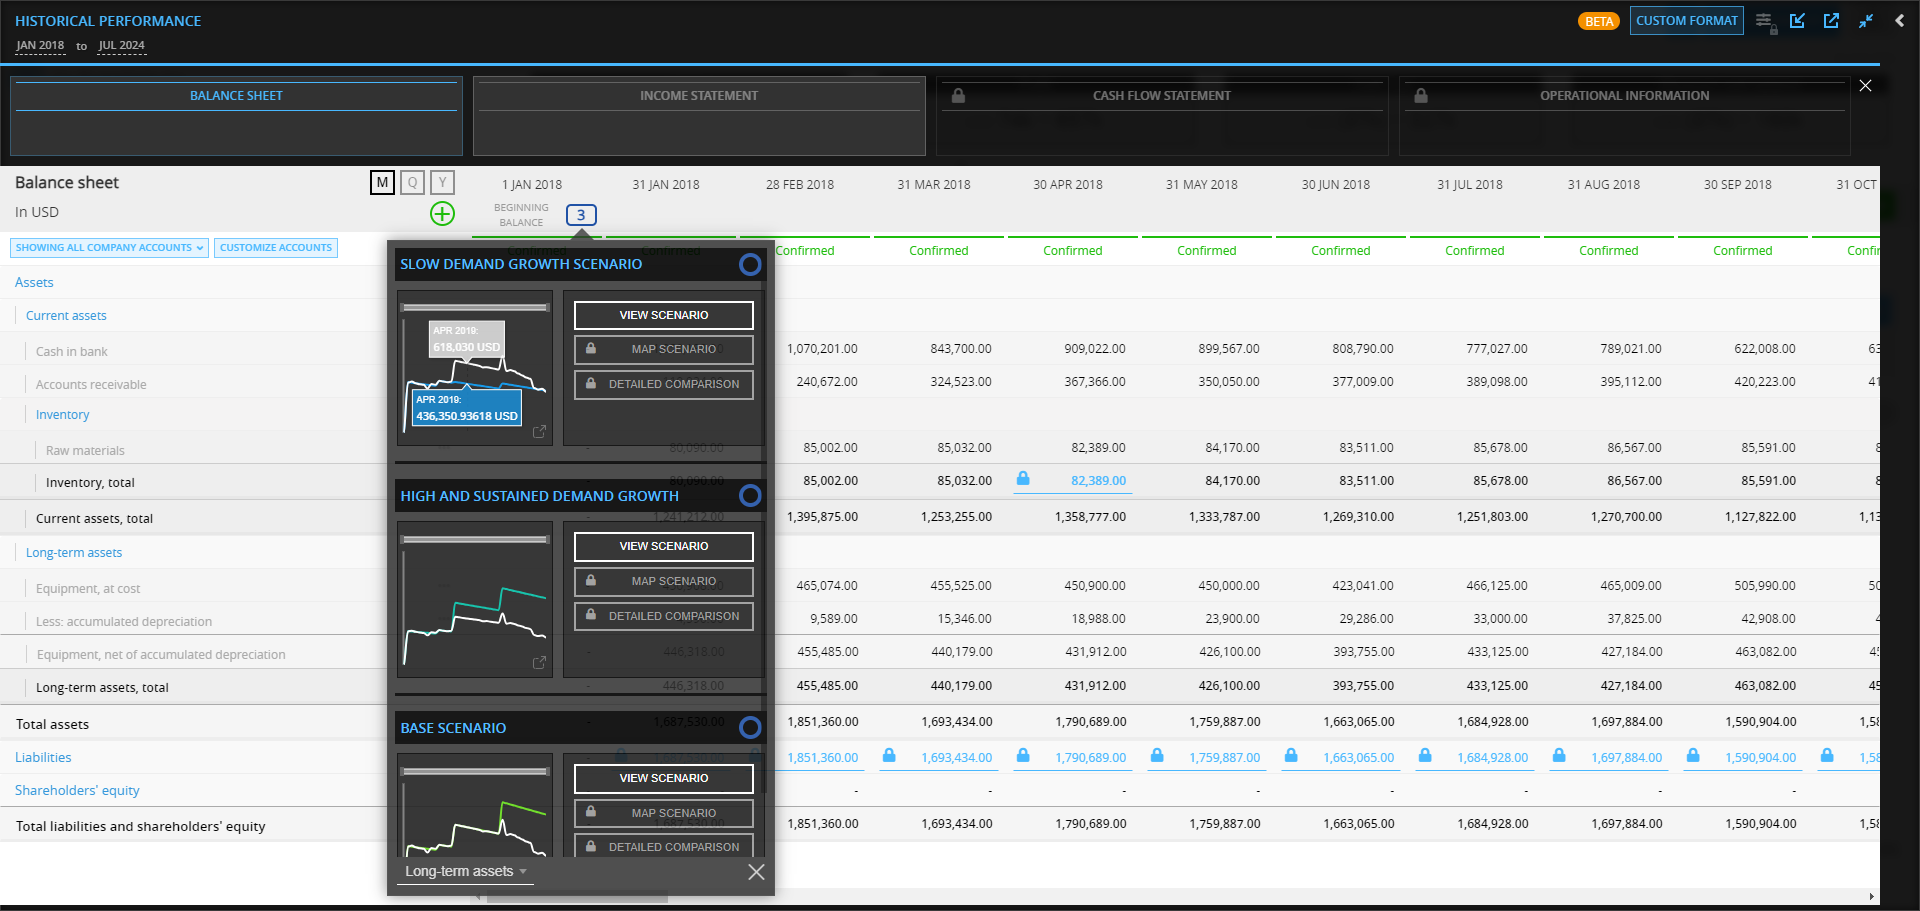
See how your actual performance stacks up against individual scenarios. Enhance your ability to make informed decisions through detailed, interactive comparisons—without the need to toggle between different views.
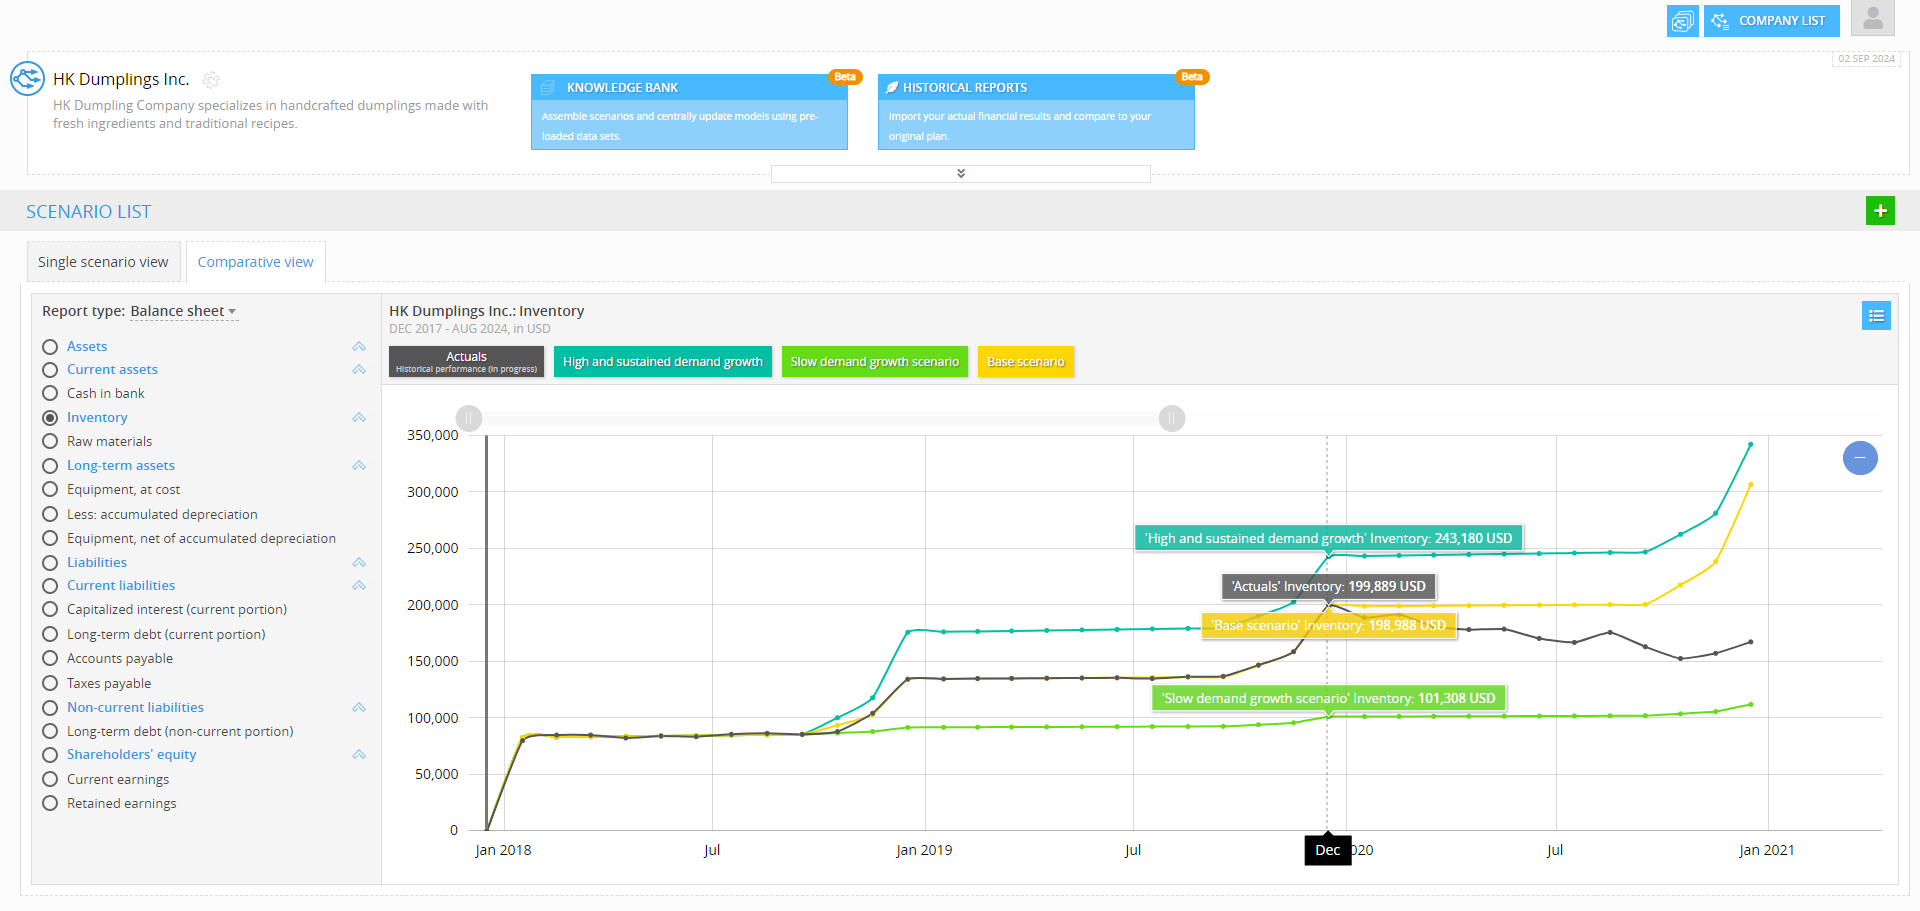
Now, you can easily compare past actual performance with selected projected scenarios in Comparative view, allowing you to select any scenario for direct comparison over time.
Looking Ahead: What’s Next for Historical Performance
As you explore the powerful new tools in Decision Critical’s Historical Performance module, there’s even more on the horizon to look forward to. Soon, you’ll be able to dive even deeper into your financial data with upcoming features like variance analysis for Cash Flow (driven directly by bank account data) and variance analysis for Operational Information (to leverage Decision Critical’s digital twin functionality to flag specific operational divergences).
Stay tuned for more updates and happy modeling!

Happy modeling!
Decision Critical